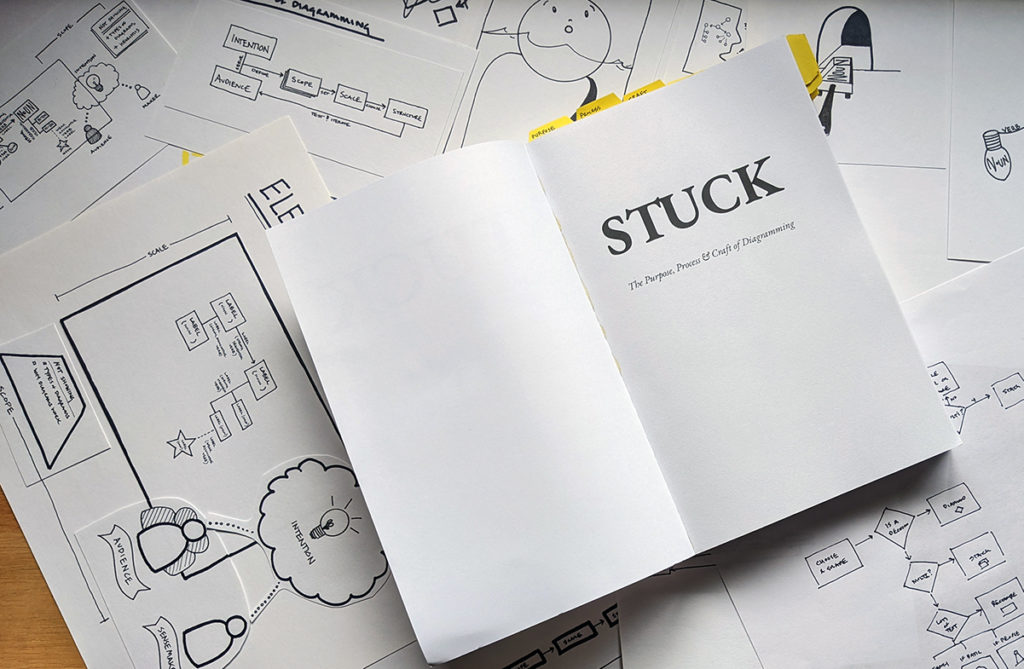
Researching Diagrams
When I started writing a book about a topic as broad as diagrams, I knew quickly that I was totally in over my head when it came to the academic and larger cultural context surrounding diagrams and diagrammatic craft.
I had spent more than my requisite ten thousand hours diagramming and teaching others to diagram. But in terms of academic rigor, I had stitched together a rather unique quilt of diagrammatic experience and education that was limited by my own context as a thinker, writer and diagrammer.
This meant that while I had a lot to say about diagrams and diagramming, I also had a ton of questions. Many of which turned out to be questions about things that I thought I already knew.
As the weeks and then months of writing went on, I kept running into times when I wrote something and then immediately thought “Hm, I wonder where I first learned that?” or “I wonder if we know that this works generally, or if it just works in my past experiences?”
I returned to my personal library and ripped back through the books I remembered mattering the most to me as I learned to diagram over the years, some of which I hadn’t spent much time with since college or my early days in IA.
I also dusted off my limited desk research skills and tried to find what I could. But when I had exhausted my own experience, education and limited internet research abilities, I was still left with a lot of unmet curiosity and unanswered questions.
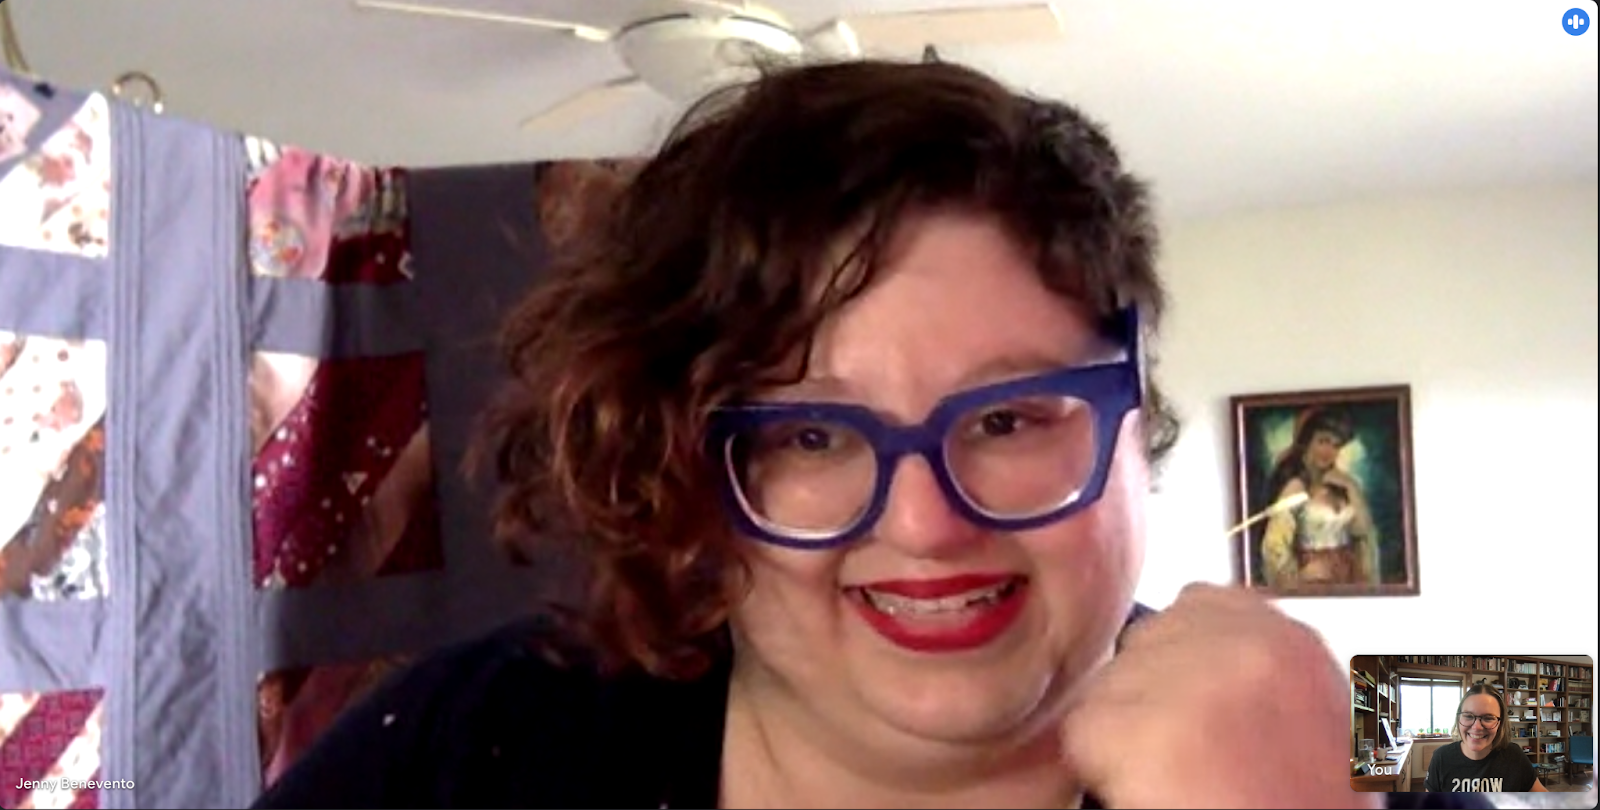
Luckily I have a long-standing weekly video chat with one of the most curious and research-minded people one can know – Jenny Benevento, a taxonomist, librarian, and lover of hats, subtle beverages and goth rainbows.
On one such call, I expressed to her how many questions I had about diagrams and how hard I was finding it to get past the limits of my own experience and research skills.
I said something like “I only know what I know, how do I figure out how to know more than that?”
Turns out the answer is librarians. When you have reached the end of what you think you can find or know, ask a librarian. They will always find more. And better.
Jenny reminded me of the power of this important discipline as she single-handedly dismantled the concept of diagrams and then methodically whipped it into submission for proper and thorough examination (from her home, during a global pandemic…but I digress)
When she first started poking at diagrams academically, I made a list of fields that I thought represented the places where diagrams might be studied or otherwise discussed.
- Cartography: the study of maps and map-making.
- Cognitive Science: the study of how humans think, organize and learn.
- Graphic Design: the art and style of visual communication.
- Information Architecture: a human skill which we all use all day everyday to decide how the parts of the whole are arranged to make sense to an audience.
- Information Design: the study of how to present data effectively to reach an intention.
- Linguistics: the study of language and its structure
- Typography: the art and style of arranging type
- Visual Explanation: the study of using graphic to foster understanding and comprehension.
I also had a list of resources and questions about diagrams that I had compiled through my writing process, most of which were directly related to my planned citations and endnotes.
My questions for Jenny tended to revolve around two themes:
- When did this become a thing? Or who made it a thing?
When was the very first diagram or use of this shape or method? Who made the first swim lane diagram and why? When did arrows start getting used this way? etc…
- How do we know it works?
Is this more art or science? What standards exist and where did the various standards come from? Are they proven to be effective or just consistent? Who studies diagrams and in what contexts? Do fields share knowledge? etc…
We dug in and let’s just say it always amazes me what two humans can accomplish with a clear intention, a color-coded spreadsheet, an internet connection and some time on their hands.
I have made sense of a lot of messes in my life, but watching her make sense of this was pure magic. My most used emoji to her in our chat for weeks was 🍿 because she was dropping plot twists like a Netflix romcom.
After a few weeks, we had resolved all the citation notes I planned to, but there was just still all this there, there. We had all this insight, all this extra nerd candy and none of it had a real place in the flow of the book I was writing about how to diagram.
One day during our weekly meeting, I got the courage to ask Jenny if she would consider writing a section for the back of the book, a full literature review on the history and discourse of diagrams. I told her I thought there was a story there to tell, and that she was the right person to tell it. She said an emphatic “Yes!” and we have been hard at work bringing her piece to life ever since.
I am really excited to bring you the fuller story when the book comes out.
My work with Jenny has inspired me to think deeper about what back matter content can be, and how it can be constructed to truly support the reader’s journey, not just check a box for the citation police.
We are thinking about the back matter of this book as hopefully useful over your whole diagrammatic lifetime. Jenny and I are also partnering on an indexed lexicon as well as a collection of resources that we think you will find useful.
When we started this wild ride, we decided we wanted the back of the book to feel like walking up to a reference librarian and saying:
“So, what’s the deal with diagrams?”
And it is well on its way to being exactly that. And yes, there may be a diagram or two for the parts where we got stuck along the way.
In the below interview I asked Jenny about her work on this project and to share some key insights into the historical academic pursuit of diagrams across fields of study. I hope this starts to get you as excited as I am about how much there, there really is when it comes to diagrams.
An Interview with Jenny Benevento, Taxonomist & Librarian
First, introduce yourself to our dear reader. Who are you and what unique patchwork quilt of experience are you bringing to this project?
I’ve worked in libraries for 30 years and done a lot of the jobs you can do in them—from shelving books to making websites to summer reading programs to cataloging 50 year old Soviet serials to buying rare math texts to just sitting behind that desk answering questions. In library school I specialized in classification systems (yes, like the Dewey Decimal System) and indexing. Since then I’ve been making metadata & taxonomies for news (AP), libraries & museums (IMLS) and e-commerce (Sears/Kmart, Etsy).
There were two positions most relevant to this project. The first was working in the math and engineering libraries at UIUC, because a lot of diagrams and symbols go back to mathematical logic, circuit diagrams, fluid engineering, or early computing. The other very relevant job was working at Wolfram, where I kept a bibliography of works in A New Kind of Science, a new field proposed by Stephen Wolfram. Bibliography is its own field of library science, which people take whole classes on, something I didn’t even know until library school!
As someone who isn’t a librarian by trade, to me the task I proposed initially seemed really daunting…and yet, you never actually seemed daunted. What was your process? How did you make sense of this mess I handed you?
Librarians take an entire class about answering research questions. We call the process of answering questions “the reference interview,” because usually the question people ask isn’t the answer they’re actually looking for. For example, a kid will come up and ask for a book about animals, when really they need a book at the 3rd grade level about reptiles that’s a certain number of pages so they can write a report. We see in search data people aren’t great at adding the context to their searches, because they’re so deeply in the question, so having another person there to clarify questions makes them a lot easier to answer. Your questions started as “Who was the first person to do this?” and became “What’s the story about how we all came to agree with this?”
People who don’t have an affiliation with an academic library aren’t seeing the majority of academic information available digitally, including a lot of research paid for with tax dollars. Because of that I think most people don’t know what questions are difficult and which aren’t! We all love the single google box, but for formal records, knowing which databases have what information and how they are described saves a lot of time.
What’s the thing that has surprised you the most about diagrams?
One guy just invented the line, area, and bar graph all in the span of a year or so. We see those every day and this guy did all that in one year. May we all have one year like William Playfair!
We assume diagrams are helpful to others because through making them we help ourselves understand something. We’ve done shockingly little scientific research that the most widely adopted diagrams are useful to most users.
I don’t mean to be a spoiler, but since I am the publisher I guess I can be, what was your big conclusion about diagrams? Why did I send you all those popcorn emojis!? The readers want a taste of that hot tea.
Diagrams started as only for elites, academics, the wealthy, but they became used by common people at work as a crucial part of industrialization and assembly lines. Now, with the computing power we have, they’re fully democratized, being used as art, to describe our emotions, and ultimately our own personal lives. What once described the stars or a factory’s inner workings are now what we use to understand ourselves!
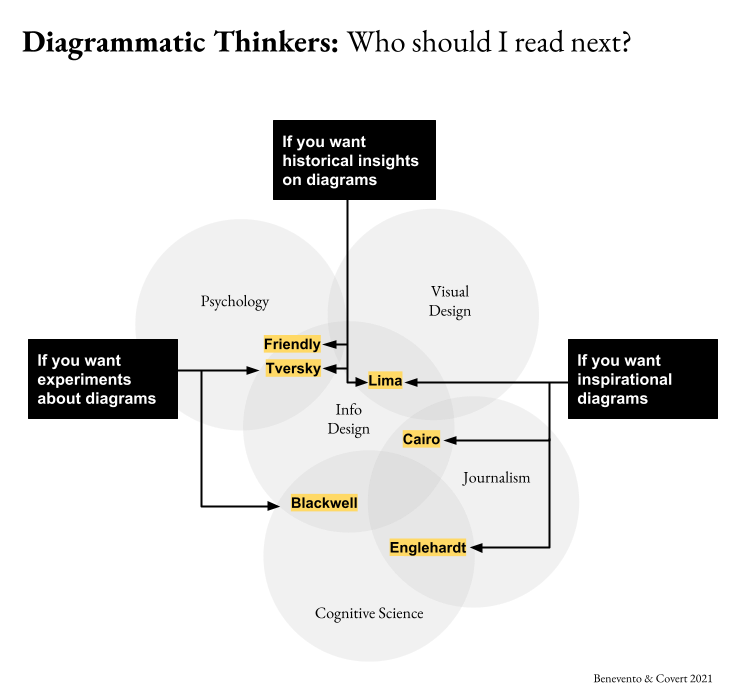
While people are waiting for the book to come out, who else might they be reading? Who is writing about diagrams academically?
For the history of diagrams, I’d recommend Manuel Lima and Michael Friendly. For user experimentation around diagrams I’d suggest Alan F. Blackwell and Barbara Tversky. From an infographics and news perspective, I’d recommend Yuri Englehardt and Alberto Cairo. There are many more people who write about each little niche’s diagrams, so feel free to hit me up if you only care about Sankey diagrams or something. I’m adding all of the papers I looked at to this pinboard if you want to follow along!
(…back to Abby’s voice)
We have provided further context around the fields of study of each of these diagrammatic thinkers diagrammatically below, because why not… and of course!
It’s like if a decision tree and a Venn had what we hope you find to be a really helpful librarian baby.
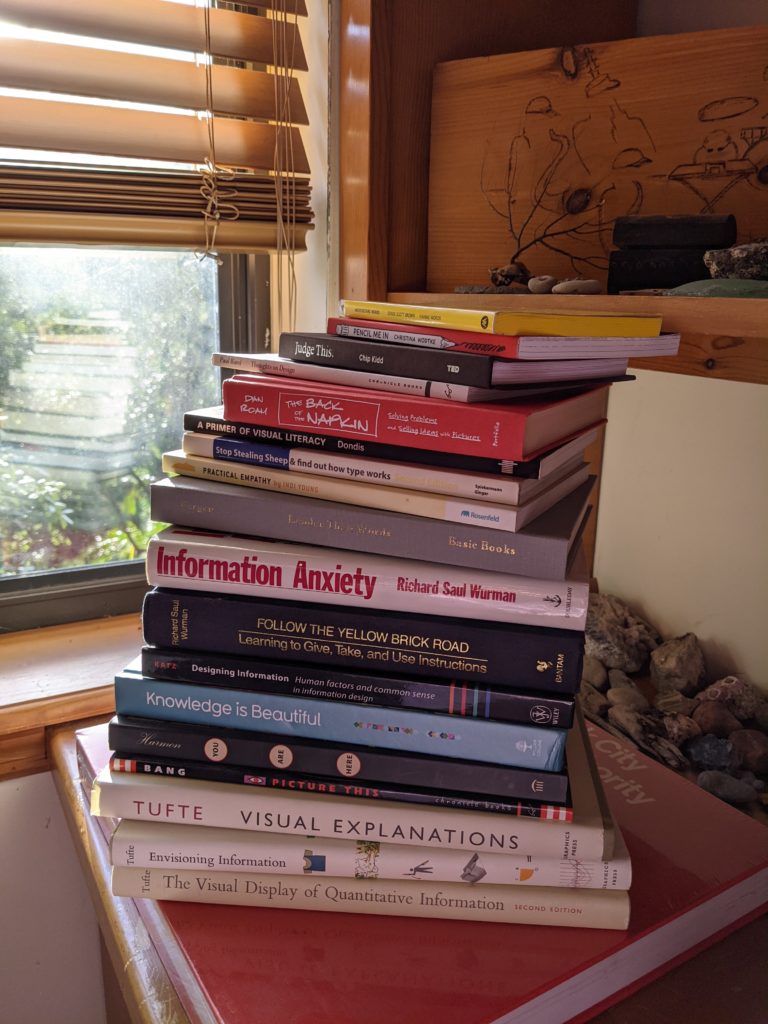
Recommended Practical Reads
From my personal library, below is a list of the ten books that changed me as a diagrammer and a teacher of diagramming. Some are old, some are new; some are about diagrams, some are more around diagramming. All of are ones I would highly recommend, especially to beginner’s.
- Extra Bold by Lupton, Kafei, Tobias, Halstead, Sales, Xia, Vergara
- The Back of the Napkin by Dan Roam
- A Primer of Visual Literacy by Donis A Donis
- Thoughts on Design by Paul Rand
- Judge This by Chip Kidd
- Communicating Design by Dan Brown
- Pencil me in: The business drawing book for people who can’t draw by Christina Wodtke
- Picture This: How pictures work by Molly Bang
- Designing Information by Joel Katz
- Figure it out by Stephen P. Anderson and Karl Fast
Coming soon…