Five Superpowers of Diagrams
I have been on a journey for the last ten months to write a book about a tool I have had at the center of my personal design practice for as long as I can remember.
Diagrams are such a part of my world that it took me ten years of teaching students about “what a diagram is” and “how to diagram” before I stopped to ask what I now see as perhaps the most important question when trying to teach others about the power of diagramming.
“When are diagrams most helpful?”
To teach people to diagram, I first needed to be able to teach them what clues to look out for as to when diagrams or diagramming might be the most helpful, useful and effective tool for them to lean on.
There is a set of common forces that was made memorable and quite-witchy to pronounce as the acronym “V.U.C.A” by the US Military War College in the 1980s. This acronymed-set was first introduced to me by my friend and fellow information architect, Jorge Arango, at a time when I was experiencing and writing about quite a V.U.C.A storm.
This wicked foursome of forces are ones we have all faced, and will all face many more times. These are not special forces (even though they emerged from training them) these are all just part of being human.
The four common forces of V.U.C.A are:
- Volatility
- Uncertainty
- Complexity
- Ambiguity
As Jorge discussed in this talk, design methods might serve as a needed antidote to an increasingly V.U.C.A-filled modern world.
In my experience, diagrams are not only one of the most accessible design methods to teach to non-designers, they are also good at solving non-design problems, and are helpful to all sorts of people experiencing all sorts of V.U.C.A. This might be why we humans have been adding contexts, technologies and circumstances that lean on diagrammatic thinking (outside just design thinking) for hundreds, if not thousands of years.
By looking at how diagrams and diagramming meet the unique challenge posed by each of the forces that make up V.U.C.A I uncovered what I believe to be the five of the highest-value superpowers that diagrams use to be their most helpful.
#1 Diagrams provide stability in the face of volatility.
Diagrams can be like a bridge over the chasm of volatility.
Volatility is the uneasy feeling we get when there is a lot of change or potential for change. It’s what we find at the emotional depths of life’s big shifts and existential changes. And, in times of volatility we often seek stability.
Diagrams are good at providing stability, which is maybe best captured by the phrase: Get everyone on the same page. Almost like the page is a liferaft for everyone to stabilize on.
While parenting through a global pandemic (a claim I truly never thought I would make) there have been times when a particular curve on a line graph flattened in a way that provided a sense of stability (however fleeting) in what felt like a sea of volatility.
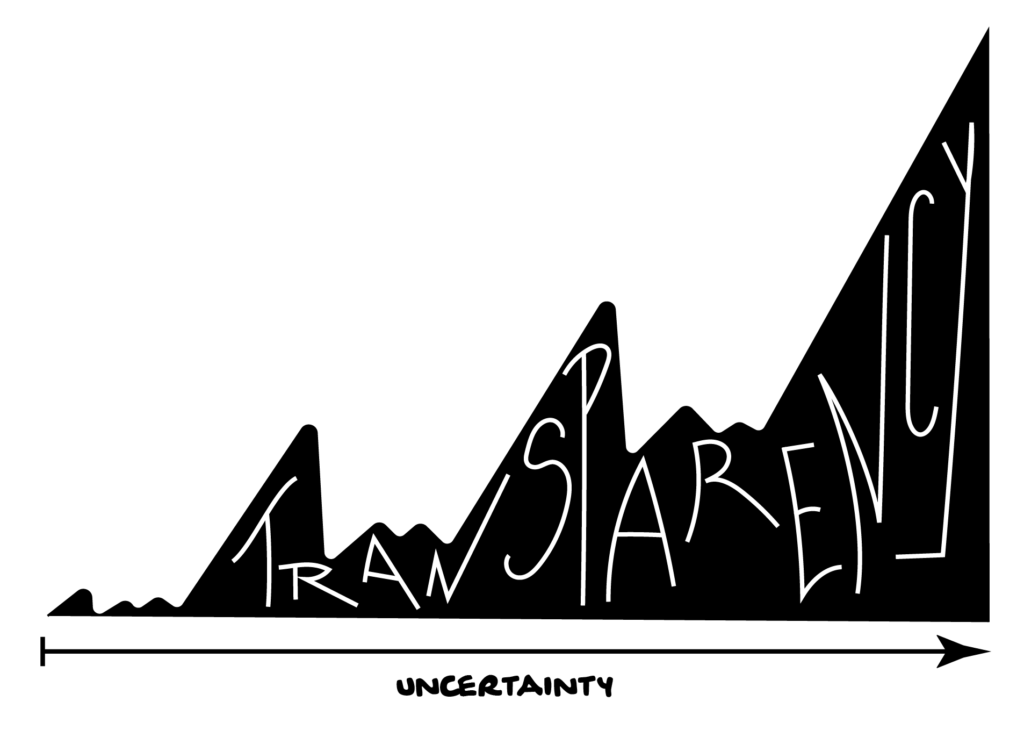
#2 Diagrams provide transparency in the face of uncertainty.

Diagrams can at least tell us what there is to know, even if the news is not good.
Uncertainty is the mounting sense of doubt about the future that can develop when we are facing a period of unpredictability or decision-making ahead. When times are uncertain, transparency helps tremendously.
Facing uncertainty is more palatable when we know that we have all the information available, and perhaps even more importantly: all the same information as everyone else.
Diagrams are often the form that information transparency takes, with visuals often being used to translate between differences of context.
For many of us, a spike in a graph or a simple color-coded map has provided a terrifying sense of needed transparency. I have lost sleep because of these diagrams but have also been able to keep my family safe through the uncertainty of it all.
#3 Diagrams provide understanding in the face of complexity.
Complexity is an inescapable reality of everyday life. Everything you see around you is complex if you are looking hard enough. And at this point in my life I have learned one thing that I am more certain of than anything else: We can’t understand the complexity of everything, and if we try to we will much more likely fail to understand anything fully at all.
Simply put, the complexity will always win and we need boundaries to survive it.
Diagrams are the boundary-defining tool that many people, teams, projects and purposes need to move forward.
Also, a little secret I learned is that the more complex whatever it is, the higher chance diagrams might help.
#4 Diagrams provide clarity in the face of ambiguity.
Ambiguity is the feeling we get when something is open to interpretation enough that we aren’t sure if our interpretation is the same as everyone else’s or what it ought to be. When we feel ambiguity on the rise, we often go looking for clarity wherever we can find it.
Think about the last thing you put together that came with an instruction manual. There were likely times where you knew where something went and other times where it was more ambiguous and you were less clear about what to do.
If I can project into your experience for a moment, my guess is that the instruction manual (especially any visuals) became more important when ambiguity was on the rise and you sought clarity.
Diagrams are great at providing needed clarity to help an audience face an ambiguous situation with more confidence and hope for a good outcome.
When I had matched the witchy foursome of forces with these four heavy hitting super powers, I was confident that I had something exciting to share with my readers. So much so, I almost went on my merry way. But the universe told me to look a little harder and I am sure glad that I did.
I mean let’s not get dramatic, Abby. It doesn’t take cosmic intervention when matching an acronym for a counter-acronym to be created.
I was hopeful representing these four with an acronym might result in something memorable enough to help the content to stick. (lol, v. much intended friends… had to do it. #sorrynotsorry)
When I saw the acronym for those four superpowers as S.T.U.C I knew immediately what that completionist ‘K’ stood for.
#5 The K is for kindness, friends.
Now, dear reader – I don’t know how well you know me at this point – so I feel the need to stop and say: I do not birth acronyms into this world without care. I am more ‘slayer of acronyms, mother of controlled vocabularies.’
Even more than that, I do not append core principles onto acronymed-sets just to make a neat and tidy word appear…unless of course, I have a very clear signal from the universe. I tell you this to say as clearly as I can, I do not add this fifth superpower at all lightly.
This is not a throw-away. Untangling this superpower was more a lightning bolt of realization about the nature of diagramming and less a completionist seeking a memorable hook for her forthcoming book. (Although, dang if I didn’t end up with both from taking the risk and listening to my woo-woo soul fire to keep going even if it got weird)
When I was interviewing people about their diagrammatic adventures, there was an energy and excitement woven through each of their stories. It felt like when living their best and most helpful lives, diagrams take on a sort of mythology.
As a diagrammer myself, this mirrored my own experience. I have felt the kind sense of relief that diagramming and diagrams can bring. I have experienced the kind place that a diagram can provide for people to dig deeper, be more curious and make more progress than they can with words or in their heads alone.
I started to realize that diagramming is often a kindness. Maybe more often than any other of the superpowers if I’m being bold, which I am.
Diagrams allow us to take our time while remaining focused on the bigger picture. Like walking away from a jigsaw puzzle, knowing you can come right back to it.
We can emotionally hit pause when things get deep or weird or scary. We can take a bathroom break or a walk or get a tea. And it will all still be there for us when we return ready to trudge ever further.
The impact of this kindness becomes even more healing when we are digging deep with others and know we can pause or slow things down at any point while always maintaining our ability to jump right back to where we were.
With a diagram, we always have that same page for us to all get on and this is not only a kindness to our colleagues and collaborators but also a kindness to our own bodies, minds and spirits as we tackle evermore V.U.C.A-fueled, urgent and often personal challenges.
Sometimes diagramming is a kindness we give to ourselves to get our bearing on something we are stuck on. Sometimes diagramming is a kindness we can give to others by translating something that has them stuck into something that helps them move forward.
Throughout my work this year on this book, kindness has been a major theme. Even before the latest immaculate-acronym-conception (lol, enough with the drama of it all, Abby!).
From the start of the project I knew I wanted to tackle the emotional process of diagramming, not just the mechanical part. And we can’t tackle the emotional part of pretty much anything without giving and receiving kindness.
Not only did the completionist-K leave space for a lesson I desperately needed permission to include in my diagrammatic teaching, it also revealed the simple, everyday word that I had been searching for to describe that feeling for when a diagram is needed.
Diagrams help when we feel stuck.
—
Thanks for reading. If you want to be one of the first to find out when STUCK: the Purpose, Process & Craft of Diagramming is released, and to follow along with monthly process updates, join my email list below.

