The Sensemaker’s Guide to Diagramming & Modeling
When was the last time you felt stuck? Maybe it was a complex project with too many moving parts. Perhaps it was a difficult conversation where words alone weren’t getting your point across. Or maybe it was simply trying to understand something that felt just beyond your grasp.
Whatever it was, I bet a diagram would have helped.
This article covers:
What is Diagramming? What is Modeling?
Let’s start with a simple definition:
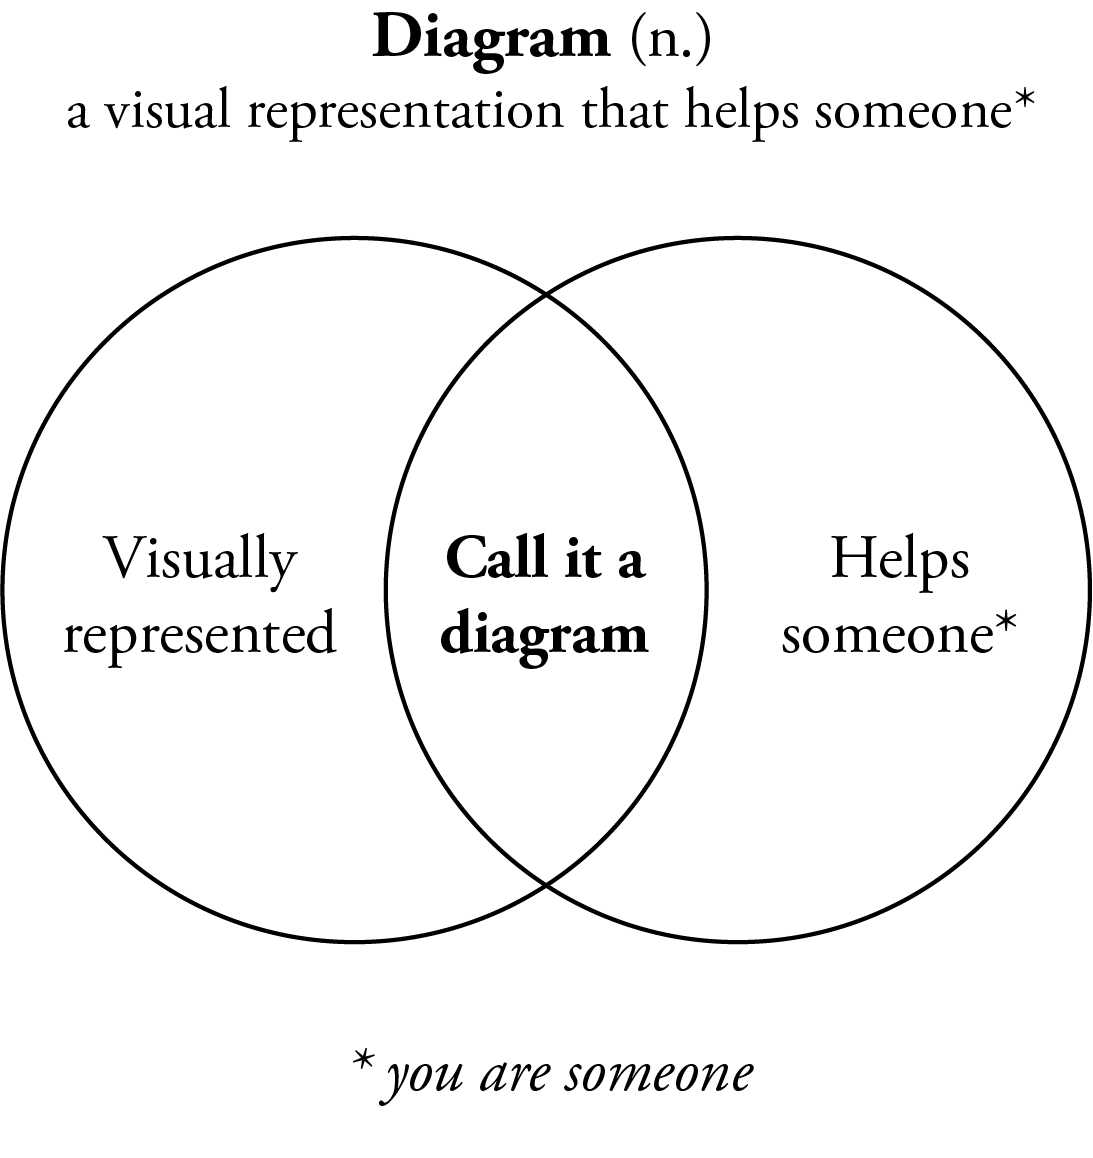
A diagram is a visual representation that helps someone.
That’s it. If it’s visually represented and it helps someone (even if that someone is just you), congratulations—you’ve made a diagram.
Modeling is creating a representation of something to help us understand it better.
Models don’t have to be visualized to be represented, but when we visualize models, we’re diagramming. For example, writing out the definition of diagram like the above might be the right representation of the model I am trying to teach, but a diagram might help draw the attention of the audience to the two pieces coming together.
The distinction between the two is subtle but important:
- Diagramming is about creating a visual artifact
- Modeling is about the thinking process behind it
Reasons to Diagram
When we face volatility, uncertainty, complexity, and ambiguity, diagrams offer us:
- Stability in times of volatility
- Transparency when facing uncertainty
- Understanding of complexity
- Clarity through ambiguity
- Kindness to ourselves and others
That last one might surprise you, but diagrams truly are an act of kindness. They reduce cognitive load and create shared understanding. They give us a place to put our thinking so our brains can rest.
Common Use Cases for Diagramming
People diagram for countless reasons, but some common scenarios include:
- Explaining complex systems to people who need to understand them
- Facilitating decision-making by visualizing options and relationships
- Planning projects by mapping tasks, timelines, and dependencies
- Analyzing problems by breaking them down into manageable pieces
- Communicating concepts that are difficult to express in words alone
- Organizing information to reveal patterns and insights
- Creating a shared understanding among team members or stakeholders
Types of Models
Below are some of the types of models you are likely to run into in the wild world of sensemaking.
Structural model
A structural model defines the static relationships between entities or components within a system. It answers “What exists and how is it connected?”
These models typically include classes, objects, components, or data structures and their relationships.
Example: Airbnb’s database schema
Airbnb uses a structural model to define how entities like Users, Listings, and Bookings relate.
Process model
A process model illustrates the sequence of activities, decisions, and flows in a system or workflow. It answers “What happens, in what order, and under what conditions?”
Common formats include flowcharts, BPMN diagrams, and swimlane diagrams.
Example: Amazon’s order fulfillment workflow
Amazon uses a Business Process Model and Notation (BPMN) process model to map how an order moves from purchase to delivery:
Behavioral model
A behavioral model represents how a system reacts to internal or external inputs over time. It answers “How does the system behave or respond?”
Often includes state machines, interaction diagrams, or logic models.
Example: Thermostat control logic in Nest
The Nest Thermostat uses a behavioral model to decide when to heat or cool based on sensor input.
Conceptual model
A conceptual model represents how users or stakeholders understand a system or domain. It answers “How do people think this works?”
These are often simplified, abstract representations used to align mental models.
Example: Apple’s Human Interface Guidelines
Apple’s design team maintains a conceptual model of how users understand navigation across iOS apps.
Mathematical model
A mathematical model uses mathematical expressions, algorithms, or statistical methods to simulate real-world phenomena. It answers “What can we calculate, predict, or optimize?”
Includes equations, formulas, and algorithmic logic.
Example: Netflix’s recommendation algorithm
Netflix uses a mathematical model called collaborative filtering.
Types of Diagrams
There are countless types of diagrams out there. A common way to differentiate them is qualitative vs. quantitative. I like to think about types differently. Centering is concentration on a specific point. In my book, Stuck? Diagrams Help. I propose three main centers for diagrams to have.
Time
When asking questions of when or how, time-based diagrams are helpful.
Examples:
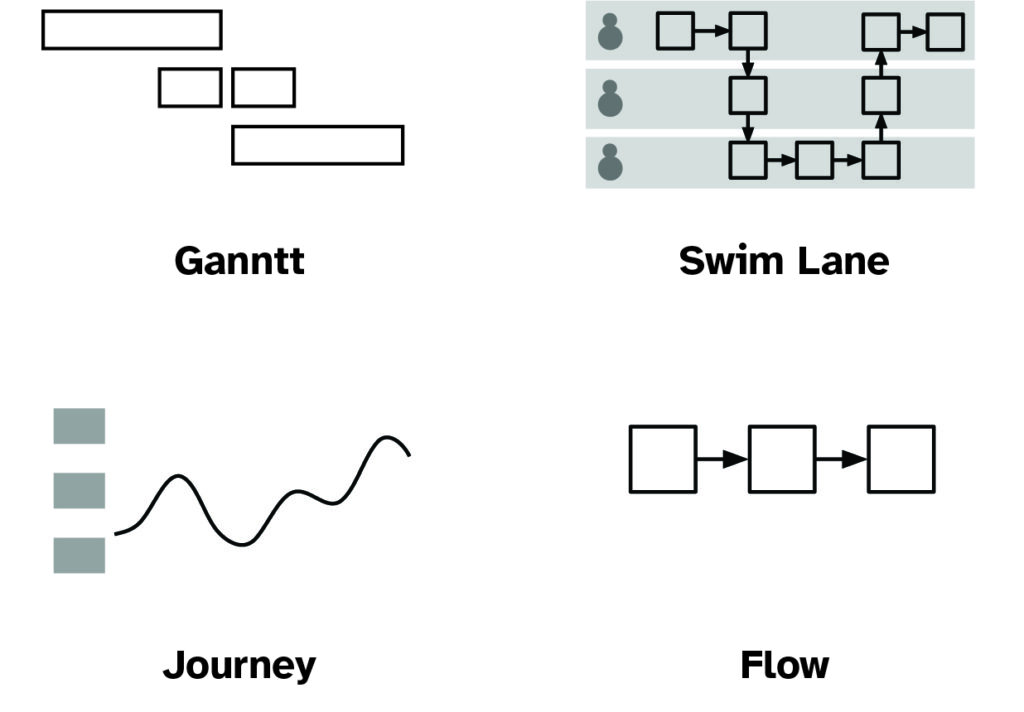
Arrangement
When asking questions of what or where, arrangement-based diagrams are helpful.
Examples:
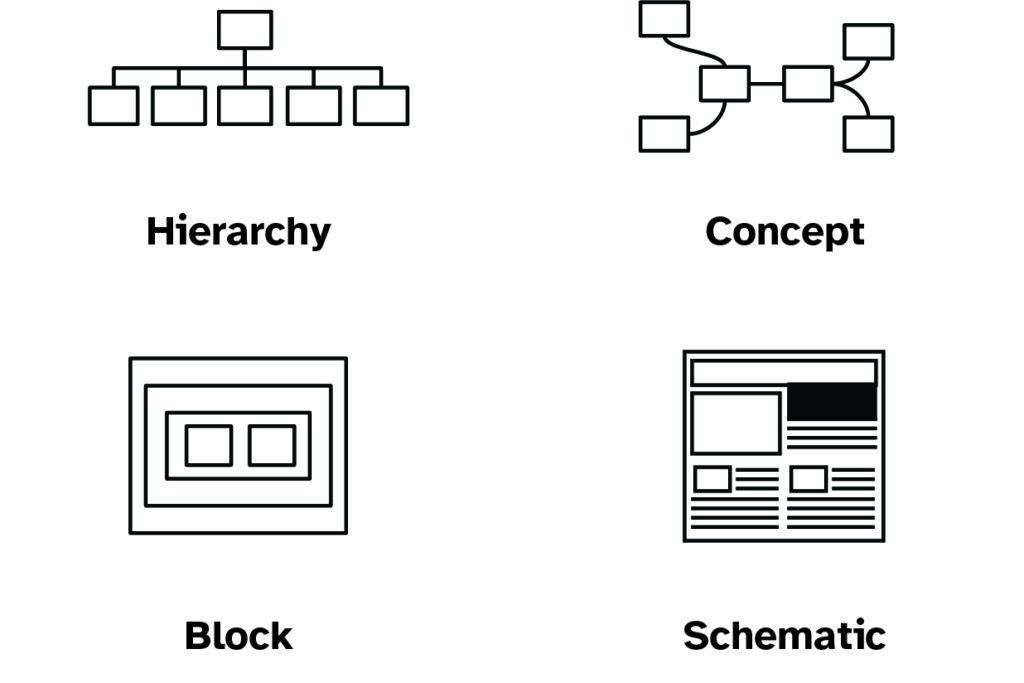
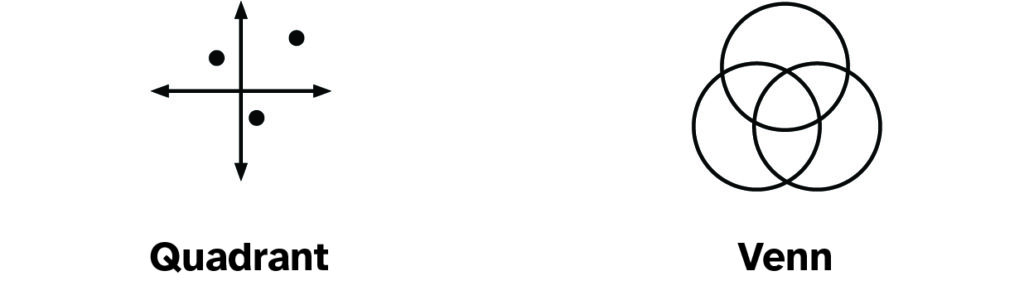
Context
When asking questions of which or why, context-based diagrams are helpful.
Examples:
As you can see each serves different needs and helps answer different types of questions.
By combining the kind of question you’re centering (Time, Context, Arrangement) with the type of model you’re working with (Structural, Process, Behavioral, Conceptual, or Mathematical), you can find the right kind of diagram to help you.
Here’s a quick cheat sheet:
| Diagram x Model | Structural | Process | Behavioral | Conceptual | Mathematical |
|---|---|---|---|---|---|
| Time | Visual Instructions | Gantt Chart | Timeline | Flow Chart | Decision Diagram |
| Context | Concept Map | Journey Map | Mental Model Diagram | Venn Diagram | Scatter Plot |
| Arrangement | Sitemap | Swim Lane Diagram | Block Diagram | Quadrant Diagram | Blueprints |
Approaching Modeling & Diagramming
Effective modeling involves a thoughtful process:
- Set an intention: What do you want this model to accomplish?
- Research your audience: Who needs to understand this? What do they know already?
- Choose your scope: What’s included and what’s excluded?
- Determine scale: How big is the space, and how detailed does this need to be?
- Iterate and refine: Diagrams are never perfect on the first try
Remember that diagramming is exploratory. You’re trying to make sense of something, so be prepared for your understanding to evolve as you work.
Tips to Getting Started
- Start simple: Use basic shapes and lines. Rectangles, circles, and straight lines will get you far.
- Use a grid: Aligning elements creates visual order that reduces cognitive load.
- Be consistent: Use the same visual language throughout (don’t mix metaphors).
- Label everything: Clear labels prevent confusion and questions.
- Test with others: The only way to know if your diagram helps someone is to test it.
- Embrace iteration: Your first attempt won’t be perfect, and that’s okay.
- Don’t overdo it: When it comes to colors, shapes, and decorative elements, less is often more.
Hot Takes
Here are some opinions I’ve formed over years of diagramming:
- There is no such thing as a bad diagram if it helps someone. What matters is effectiveness, not aesthetics.
- Diagrams made for yourself can look messier than those made for others. Different audiences have different needs.
- Fancy tools aren’t necessary. Some of the most effective diagrams I’ve made were drawn on napkins or whiteboards.
- Color-coding should always have a backup. Not everyone perceives color the same way, so don’t rely solely on color to convey meaning.
- Labels should be as concise as possible. Aim for under 25 characters for most labels.
- Line crossing is usually avoidable. If your lines need to cross frequently, reconsider your layout.
- Diagrams can reveal insights that text alone cannot. The act of visualizing information often leads to new understanding.
Frequently Asked Questions
Do I need to be good at drawing to make diagrams?
Absolutely not! Diagrams are about clarity, not artistic skill. Simple shapes and lines are all you need.
What’s the best software for diagramming?
The one you’re comfortable with. For beginners, I recommend whatever tools you already know—PowerPoint, Google Slides, or even pen and paper work great. As you advance, you might explore dedicated tools.
How do I know if my diagram is good?
If it helps someone understand something, it’s a good diagram. Test it with your intended audience and iterate based on their feedback.
What if my diagram gets too complex?
That’s a sign you might need multiple diagrams or a different approach. Consider breaking it down into smaller, more focused diagrams.
How much information should I include?
Include only what’s necessary to meet your intention. When in doubt, start with less—you can always add more if needed.
Should I make my diagram pretty?
Focus on clarity first. Visual appeal can enhance a diagram but should never come at the expense of understanding.
If you want to learn more about my approach to diagramming and modeling, consider attending my workshop on May 16 from 12 PM to 2 PM ET. Blueprint Basics: Making Models That Actually Help — this workshop is free to premium members of the Sensemakers Club along with a new workshop each month.
Thanks for reading, and stay tuned for our focus area in June – Controlling Vocabularies